


States With the Highest and Lowest Rideshare Ratings

A high rideshare rating can make a passenger look like the ideal pickup, but the number doesn’t tell the whole story. From tipping habits and rising prices to unsafe driving and uncomfortable trips, the passenger experience can vary well beyond the score shown in the app.
To see how rideshare experiences differ across the country, we surveyed more than 2,200 users about their passenger ratings, preferred apps, tipping habits, safety concerns, pricing frustrations, and negative experiences. We compared average passenger ratings by state and looked at where riders were most likely to fall above or below the average rating.
The findings reveal which states have the highest- and lowest-rated passengers, how often riders tip, what makes a trip go wrong, and how rising costs are changing the way people use services like Uber and Lyft.
Rideshare ratings can shape how smoothly a trip gets matched, but passengers don’t all earn the same scores. Our survey found that some states consistently came in near the top, while others had a larger share of riders falling below the study-wide average.
Across the full study, the average passenger rating was 4.87, while 52% of respondents said they always tip their driver. Because the differences between states were often marginal, we used the percentage of respondents who always tip as a tiebreaker when states had the same average rating.
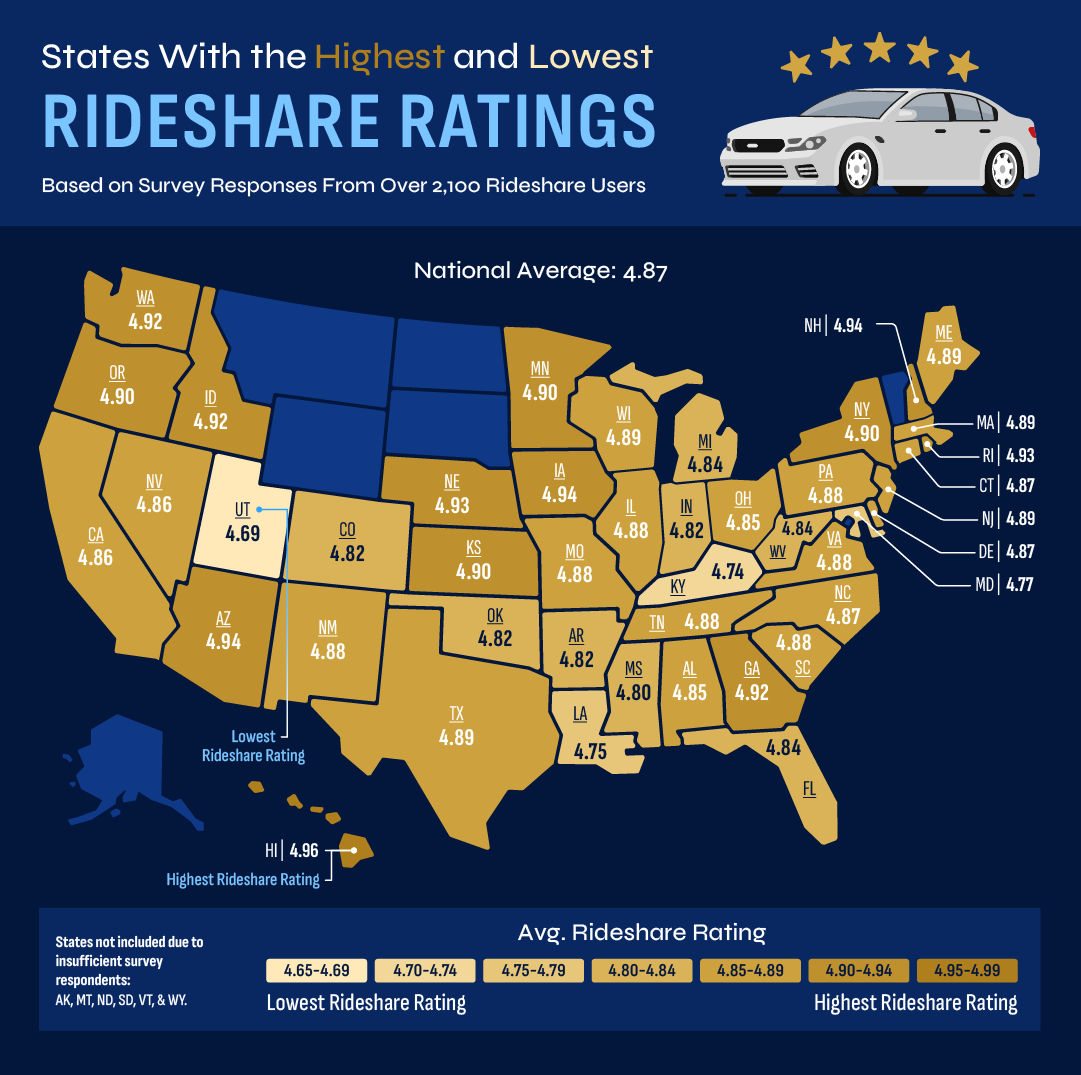
The top of the ranking was led by states where riders came especially close to a perfect 5.0.
States with the highest average rideshare ratings:
- Hawaii: 4.96 average rating; 61.5% always tip
- New Hampshire: 4.94 average rating; 85.4% always tip
- Arizona: 4.94 average rating; 57.1% always tip
- Iowa: 4.94 average rating; 55.6% always tip
- Nebraska: 4.93 average rating; 55.8% always tip
- Rhode Island: 4.93 average rating; 53.5% always tip
The top of the ranking is incredibly tight but there was one state that stood out above the rest, if only just barely. Hawaii earned the highest average rating in the study at 4.96, putting its riders a mere few hundredths of a point away from a perfect score.
New Hampshire, Arizona, and Iowa followed very closely at 4.94, but New Hampshire won the tiebreaker by a wide margin. More than 85% of respondents there said they always tip, the highest rate in the study.
At the other end of the ranking, we have the rideshare users that are further away from perfect. Though even the worst-performing states still posted relatively high average ratings even if they’re noticeably lower than the study leaders.
States with the lowest average rideshare ratings:
- Utah: 4.69 average rating; 50% always tip
- Kentucky: 4.74 average rating; 60.8% always tip
- Louisiana: 4.75 average rating; 58.3% always tip
- Maryland: 4.77 average rating; 42.3% always tip
- Mississippi: 4.8 average rating; 47.9% always tip
Utah ranked last with an average passenger rating of 4.69, making it the only state in the study to fall below 4.70. Kentucky and Louisiana followed, though both had above-average tipping rates.
Maryland stood out for a different reason. Its average rating ranked near the bottom, and only 42.3% of respondents said they always tip, well below the 52% study-wide rate. Still, the broader takeaway is that even the lowest-rated states remained well above 4.5, showing how uncommon truly low passenger ratings are.
Where Are Riders Most and Least Likely to Fall Below Average?
Average ratings give us a good midpoint for how a typical rideshare user acts, but they can smooth over how ratings are distributed within each state. To get a clearer picture, we also looked at the share of respondents whose passenger rating fell below the study-wide average of 4.87.
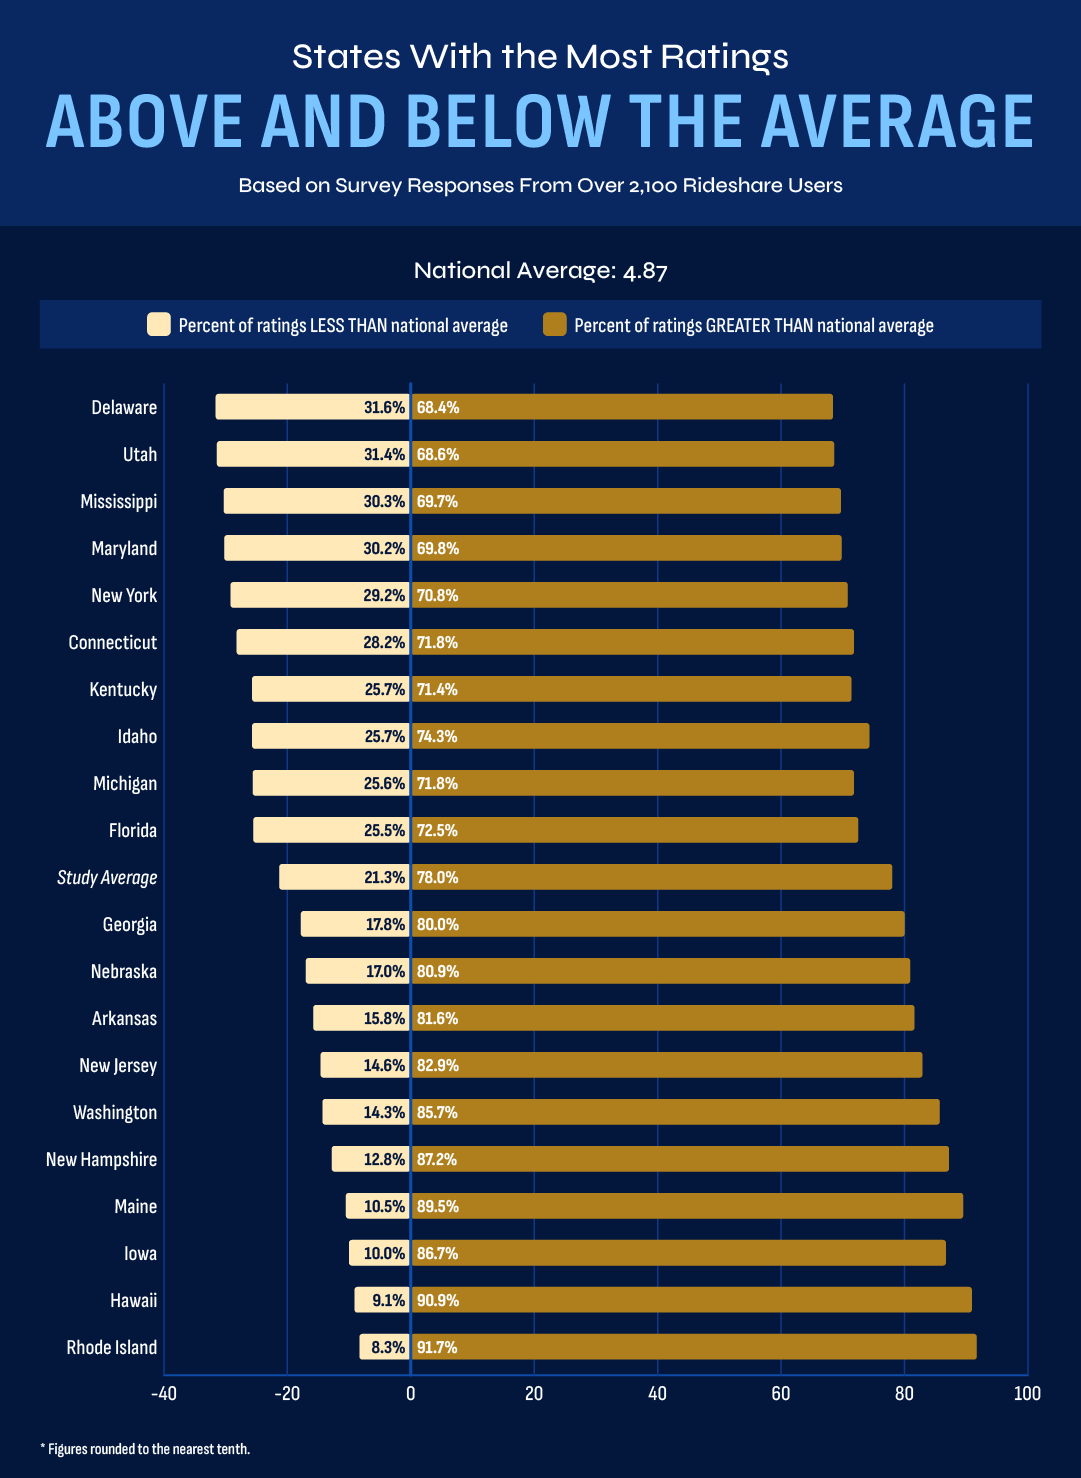
The states with the highest percentage of below-average ratings:
- Delaware: 31.6%
- Utah: 31.4%
- Mississippi: 30.3%
- Maryland: 30.2%
- New York: 29.2%
In each of these states, close to 3 in 10 riders had a rating below the study average. Utah, Mississippi and Maryland also appeared among the states with the lowest overall ratings, so their placement here follows the same pattern.
Delaware was the outlier. It had the highest share of below-average riders, even though it didn’t rank among the states with the lowest average rating, suggesting its ratings were less consistent, with enough highly rated riders to keep the overall average from dropping further.
The states with the lowest percentage of below-average ratings:
- Rhode Island: 8.3%
- Hawaii: 9.1%
- Iowa: 10%
- Maine: 10.5%
- New Hampshire: 12.8%
Rhode Island had the smallest share of riders below 4.87, followed closely by Hawaii. Iowa and New Hampshire also performed well by both measures, ranking near the top for average ratings while keeping the portion of below-average riders relatively low.
High state averages were often backed by consistency across a large share of riders. Next, we’ll look beyond passenger scores and dig into overall rideshare experiences, how often negative ones happen, and what tipping habits reveal about riders across the country.
Passenger ratings offer one view of the rideshare experience, but they don’t show what happens during the trip itself. Our survey found that safety concerns, tipping habits, and rising prices all shape how riders feel about the service. And how often they use it.
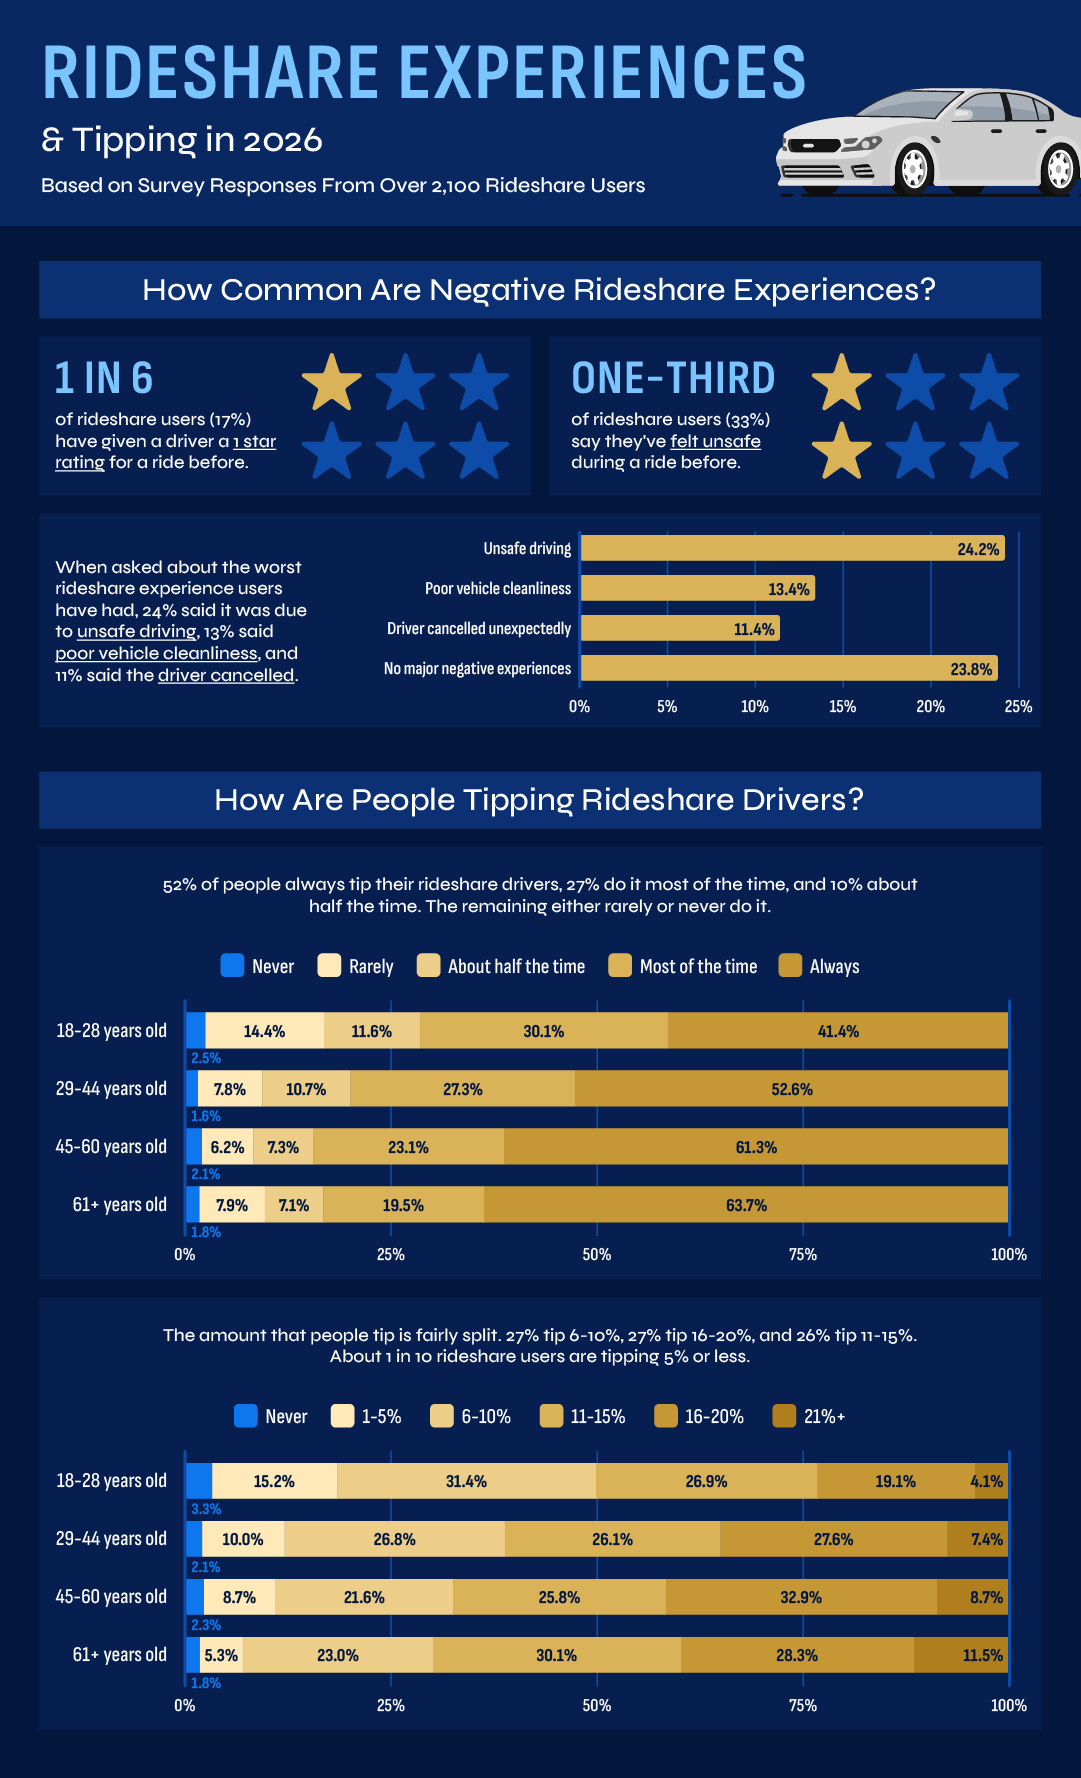
Safety Concerns Can Leave a Lasting Impression
Most rideshare trips may be routine, but a bad experience can quickly change how a passenger views the service. One-third of rideshare users said they’ve felt unsafe during a ride before.
When respondents described their worst rideshare experience, the most common problems were:
- 24% cited unsafe driving.
- 13% pointed to poor vehicle cleanliness.
- 11% said their driver canceled.
Unsafe driving stood out by a wide margin, suggesting that what happens behind the wheel matters more to riders than comfort or convenience when a trip goes wrong. A dirty vehicle may make for an unpleasant ride, but dangerous driving can turn it into a much more serious experience.
These negative trips can also affect driver ratings. About one in six rideshare users said they’ve given a driver a 1-star rating before. A meaningful share of riders have had an experience bad enough to give the lowest possible score.
Most Riders Tip, but Habits Vary by Age
Tipping is common among rideshare users, though it’s far from universal. More than half of respondents said they always leave a tip:
- 52% always tip.
- 27% tip most of the time.
- 10% tip about half the time.
- The remaining respondents rarely or never tip.
Nearly four in five riders tip either always or most of the time, but we found that age plays a noticeable role in how consistent that habit is.
About 62% of riders aged 45 and older said they always tip, compared with 53% of millennials and 41% of Gen Z. Gen Z riders were also the most likely to say they rarely tip, at 14%.
The size of the tip was more evenly divided. Among rideshare users:
- 27% typically tip 6–10%
- 26% tip 11–15%
- 27% tip 16–20%
- 13% tip 5% or less
There wasn’t one clear standard tip amount. Instead, riders were almost evenly split across the 6–20% range.
Gen Z leaned toward smaller tips when they did leave one. Among Gen Z riders, 31% typically tipped 6–10%, while 27% tipped 11–15%, and 15% tipped 1–5%.
Cost may now be one of the biggest pressures on rideshare use. Nearly two-thirds of respondents said rising prices caused them to use rideshare services less during the past year.
That included:
- 33% who said they use rideshares somewhat less.
- 31% who said they use them much less.
The effect was strongest among younger riders. About 71% of Gen Z respondents said they were using rideshares less because of rising costs, compared with 66% of millennials, 56% of Gen X, and 46% of baby boomers.
That gap may reflect how younger riders use rideshare services, but the broader pattern is clear: As prices rise, usage falls.
Surge pricing also remains a source of frustration. About 19% of riders said it’s never fair, while another 27% said it’s rarely fair. Only 16% considered surge pricing usually or always fair.
In other words, nearly half of rideshare users view surge pricing negatively, while relatively few regularly see it as justified. For riders already cutting back because of cost, unpredictable price increases may make the decision to skip a trip even easier.
Rideshare users weigh more than convenience when deciding whether to book a trip. Safety concerns can shape how riders rate their drivers, tipping habits vary widely, and rising prices are pushing many users to ride less often.
Most passengers maintain strong rideshare ratings, but the results show that the experience can vary depending on where riders live, how they tip, and what happens once they get in the car. Safety was an especially important part of the story, with one in three riders saying they’ve felt unsafe during a trip and unsafe driving ranking as the most common worst experience.
A low rating may be inconvenient, but a dangerous ride can have much more serious consequences. When an Uber, Lyft, or other rideshare vehicle is involved in a crash, injured passengers may face medical expenses, missed work, and complicated questions about insurance and liability.
Hartley Law helps people injured in rideshare and other car accidents understand their options and pursue the compensation they deserve.
Methodology
To determine the states with the best rideshare ratings, we surveyed over 2,100 rideshare users across 44 states and asked them to access their preferred rideshare app (either Uber or Lyft) and tell us what their passenger rating is. We also asked about their rideshare experiences in general to see how people view the service today. Respondents were screened by rideshare usage and a balanced sample was applied for the 44 states surveyed.
The survey ran over two weeks in July 2026. States not included due to insufficient survey respondents: Alaska, Montana, North Dakota, South Dakota, Vermont, and Wyoming.
Fair Use
You are welcome to use, reference, and share non-commercial excerpts of this study with proper attribution. If you cite or cover our findings, please link back to this page so readers can view the full methodology, charts, and context.