The Most & Least Dangerous States for Bar Hopping & Nightlife

A night out is supposed to be fun — a few drinks, good music, a packed bar. But depending on where (and when) you go out, nightlife can come with very different levels of risk. From rowdy holiday weekends to high-traffic party districts, bars and nightclubs are also some of the most common settings for fights and other violent crimes, and the data shows those patterns aren’t evenly distributed across the U.S.
To understand where nightlife and bar hopping is statistically most and least risky, we analyzed violent crimes reported in bars and nightclubs using FBI crime data between 2015 and 2025. The FBI categorizes violent crimes into four categories: assault, homicide, rape, and robbery. We compared states using a per-100,000-residents violent crime rate to account for population size, and also looked at total incidents to see which states have the highest overall volume. Finally, we examined the seasonality by month and the trend by year over the past decade to see when nightlife violence tends to spike.
Key Findings
- The top five most dangerous states for nightlife (violent crimes in bars/nightclubs per 100K residents) are North Dakota (110.34), Montana (104.78), South Carolina (82.48), Colorado (67.09), and Iowa (61.30).
- The top five least dangerous states for nightlife (violent crimes in bars/nightclubs per 100K residents) are Pennsylvania (7.91), Maine (8.53), Florida (10.10), New Jersey (10.99), and Vermont (11.43).
- In total incidents (not adjusted for population size), Texas ranks first by a wide margin, with 12,678 violent bar/nightclub crimes, more than double California’s 5,131, despite California being more populous.
- March and October are the peak months for nightlife violence, averaging 840 and 816 bar/nightclub violent crimes per year, respectively—timing that lines up with major drinking holidays like St. Patrick’s Day (March) and Halloween (October).
- Nightlife violence surged in the early 2020s: the annual average rose from 5,927 incidents (2015–2019) to 12,379 (2021–2025), about 109% higher.
The Most Dangerous States for Going Out to Bars & Nightclubs
The 10 most dangerous states for nightlife (violent crimes in bars/nightclubs per 100K residents):
- North Dakota — 110.34
- Montana — 104.78
- South Carolina — 82.48
- Colorado — 67.09
- Iowa — 61.30
- Idaho — 57.31
- Tennessee — 52.87
- Wisconsin — 52.44
- Oregon — 51.83
- Kansas — 50.06
When we looked specifically at violent crimes reported in bars and nightclubs between 2015 and 2025, a few states stood out as clear outliers. What’s striking is that this top 10 isn’t dominated by the biggest nightlife hubs or the most populous states. Instead, several smaller states rise to the top once you adjust for population. That’s why this ranking uses a rate per 100,000 residents: it helps show where bar and club violence is more concentrated relative to the size of the state.
The list includes a mix of Plains and Mountain West states (like North Dakota and Montana) alongside states with more established nightlife scenes (like South Carolina, Colorado, and Tennessee). South Carolina and Tennessee, for example, are home to nightlife-heavy tourism hubs that draw big weekend crowds. Cities like Charleston and Myrtle Beach, SC, are known for bar-dense districts, while Tennessee’s ranking tracks with the scale of its party scene in places like Nashville. More visitors, more late-night venues, and more drinking-heavy social settings don’t automatically cause violence, but they can create more opportunities for incidents to occur.
Looking at each state’s overall violent crime rate adds useful context for why some landed in the nightlife top 10. Tennessee, for example, has the third-highest overall violent crime rate in the U.S. (592.3 per 100K residents), which aligns with its #7 ranking for bar/nightclub violence. Colorado also ranks 7th overall (476.3 per 100K), and South Carolina ranks 10th (436.7 per 100K), suggesting these states’ nightlife risks may be part of a broader violence baseline, not just a bar scene issue.
Let’s shift to the other end of the spectrum.
The 10 least dangerous states for nightlife (violent crimes in bars/nightclubs per 100K residents):
- Pennsylvania — 7.91
- Maine — 8.53
- Florida — 10.10
- New Jersey — 10.99
- Vermont — 11.429
- Mississippi — 11.430
- New Hampshire — 11.63
- Arizona — 11.87
- New York — 12.18
- California — 13.17
A few of these are intuitive — Maine, Vermont, and New Hampshire are smaller, lower-density states where nightlife is less concentrated, which can translate to fewer incidents per capita in bar and club settings. Pennsylvania topping the “least dangerous” list is also notable because it’s not a tiny state; despite having major nightlife cities like Philadelphia and Pittsburgh, its rate of bar/nightclub violent crime stays low compared to the rest of the country.
Florida is the result that tends to surprise people. It has plenty of party destinations, but once you adjust for population, it lands as the third-lowest state on this list (10.10 violent crimes in bars/nightclubs per 100K residents). The Sunshine State may have huge nightlife scenes in absolute terms, but with very large populations, the per-100K rate can still come out comparatively low.
If we take each state’s population size out of the equation, the results shift quite a bit.
The five most dangerous states for nightlife (total violent crimes in bars/nightclubs, unadjusted for population size):
- Texas — 12,678
- California — 5,131
- Ohio — 4,894
- Michigan — 4,462
- South Carolina — 4,432
What jumps out immediately is just how much Texas outpaces California across the board. Over the past decade, Texas logged 12,678 violent bar/nightclub crimes, including 10,077 assaults. California’s total is far lower at 5,131 violent crimes in bars/nightclubs, driven by 4,458 assaults. This contrast is striking because California is more populous, yet Texas reports more than double the total bar/nightclub violence in this dataset. And it isn’t just one category skewing the comparison: Texas is higher in homicide (265 vs. 44), rape (725 vs. 251), and robbery (1,611 vs. 378) as well.
One state that shows up consistently either way is South Carolina. It ranks in the top 10 when you adjust for population (#3 per 100K) and still lands in the top five when you look at total incidents (#5 overall). South Carolina appears to have both a high concentration of bar/nightclub violence and a high overall volume of incidents.
The Most Dangerous Months for Going Out to Bars & Nightclubs
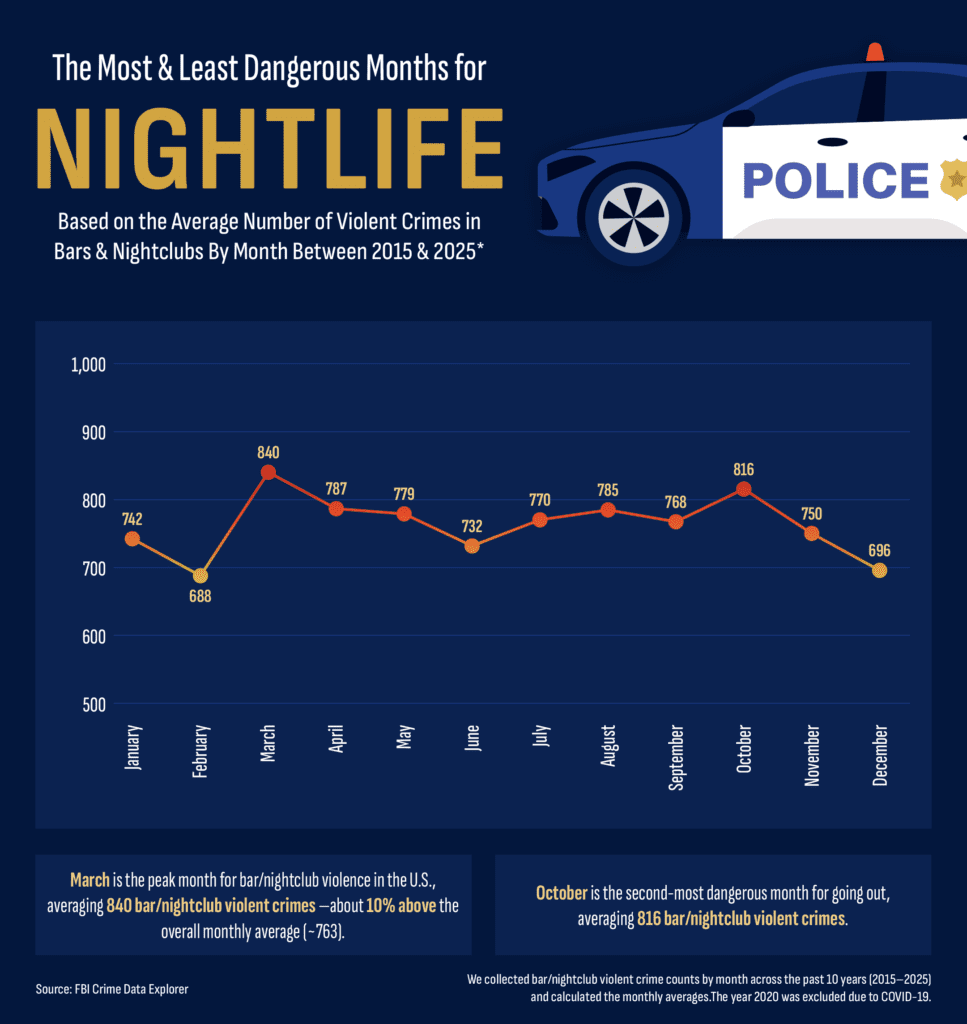
When we zoom out from geography and look at seasonality, the pattern is pretty clear: March is the peak month for bar/nightclub violence in the U.S. On average, March sees 840 violent crimes in bars/nightclubs per year, which is about 10% higher than the overall monthly average of roughly 763. October follows closely behind as the second-most dangerous month, averaging 816 incidents per year. It’s hard to pin seasonality to one single cause, but timing likely matters. March aligns with St. Patrick’s Day, and October lines up with Halloween — both holidays that tend to drive heavier drinking, packed venues, and late-night crowds.
On the flip side, February is the safest month for bar/nightclub violence at 688 violent crimes in bars/nightclubs per year, with December close behind at 696 incidents per year. Whether that’s because people go out less, the weather keeps crowds smaller, or venues have different patterns of foot traffic, the takeaway is straightforward: if you’re planning a night out (or planning staffing and security for nightlife venues), the calendar itself can be a real risk signal.
Violent Crime in Bars & Nightclubs Over the Past Decade
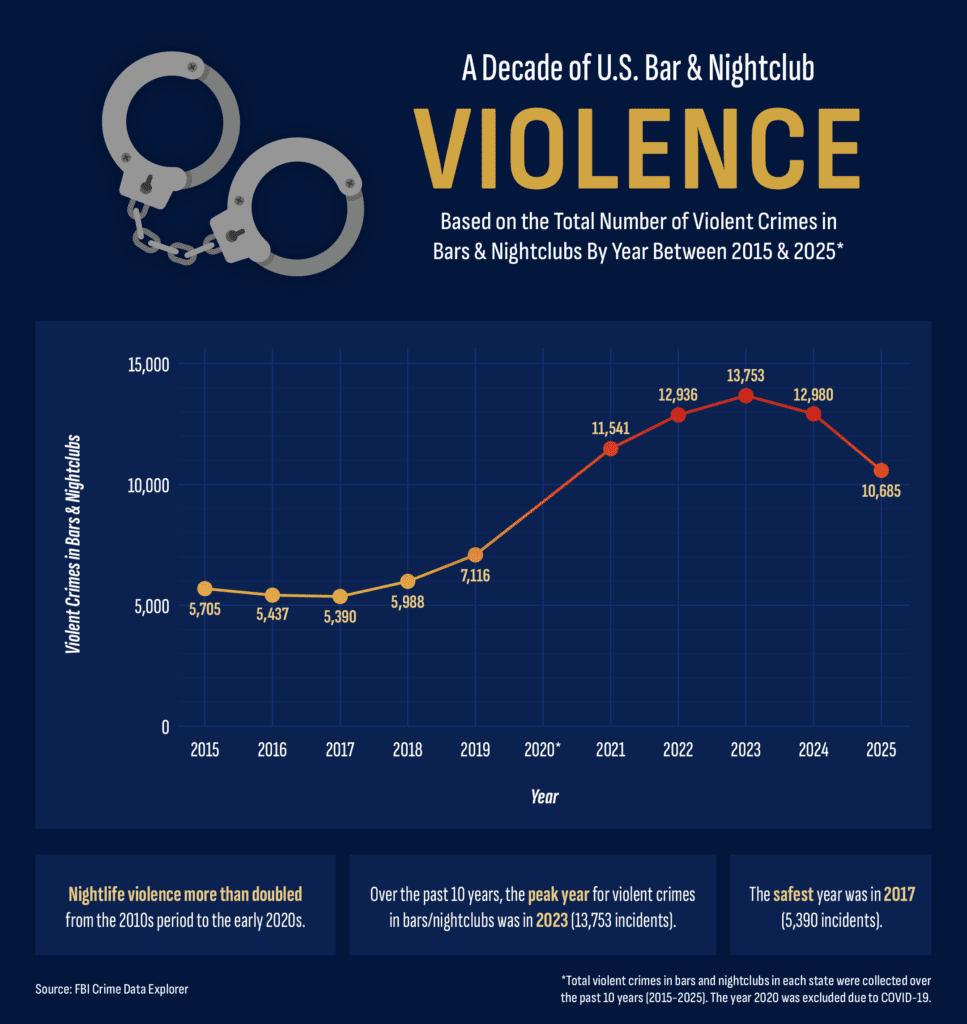
When you look at the trend over time, the shift is hard to miss: violent crime in bars and nightclubs jumps dramatically in the early 2020s compared to the years immediately before the pandemic. From 2015–2019, the U.S. averaged about 5,927 incidents per year. From 2021–2025, that average rises to roughly 12,379 incidents per year — an increase of about 109%. In plain terms, nightlife violence more than doubled from the pre-2020 baseline to the early 2020s.
Over the past decade, the single peak year for violent crimes in bars/nightclubs in the U.S. was 2023, with 13,753 incidents, while the lowest year was 2017, at 5,390. It’s difficult to point to one explanation, but the timing overlaps with pandemic-era disruption and a broader national rise in violence after COVID-19.
Closing Thoughts
Taken together, the data show that nightlife risk isn’t random: it clusters by place, time of year, and era. A handful of states stand out with especially high per-capita bar/nightclub violence, while others remain consistently low. The calendar matters too: March and October rise above the monthly norm (right when big drinking holidays hit), and the longer-term trend line is the biggest headline of all — bar and nightclub violence surged in the early 2020s compared with the years just before COVID-19. The broader point isn’t to scare people off from going out; it’s to show that the conditions around nightlife (crowds, alcohol, late hours, and seasonal spikes) can meaningfully change the odds.
For Hartley Law Firm, this topic is personal because nightlife-related violence can lead to serious injuries, and the aftermath often comes with medical bills, missed work, and insurance headaches on top of recovery. Hartley Law focuses on helping Texans who’ve been hurt pursue accountability and compensation through our personal injury practice. If you or someone you love was injured due to negligence, you can reach out to Hartley Law Firm for a free consultation to understand your options.
Methodology
We used the FBI Crime Data Explorer to analyze violent crimes occurring in bars and nightclubs. Per the FBI, “violent crime” includes aggravated assault, homicide, rape, and robbery.
We pulled totals by state across a 10-year window (2015–2025), excluding 2020 to avoid pandemic-related disruptions to nightlife. We then calculated each state’s nightlife violence rate as the total number of bar/nightclub violent crimes over the period per 100,000 residents. State population figures used for rate calculations came from the U.S. Census Bureau.
We also used the FBI Crime Data Explorer to collect the number of bar/nightclub violent crimes by month across the same timeframe (2015–2025, excluding 2020). We calculated the average number of incidents for each month to determine which months tend to see the highest levels of bar/nightclub violence.
Fair Use
You are welcome to use, reference, and share non-commercial excerpts of this study with proper attribution. If you cite or cover our findings, please link back to this page so readers can view the full methodology, charts, and context.